Dynamic Evolution of Pyrogeography
Fire regimes are changing but our understanding of pyrogeography tends to be static. We study the dynamic evolution of pyromes over time to see how they cluster and transition.
Full paper coming soon!
A "pyrome" is a distinct cluster of landscape cells that share similar fire activity characteristics (Archibald et al., 2013).
This project uses unsupervised machine learning on the Global Fire Atlas (2002–2025) to cluster five distinct pyrome classes at 1-degree spatial resolution for every four-year interval. The five key variables driving clustering are: fire frequency, size, expansion rate, duration, and perimeter (Andela et al., 2019). We generate the global pyrome maps at 1-degree resolution similar to previous studies (Pais et al., 2023)
We use unsupervised learning (k-means) on input data prepared for every four-year interval (between 2002 to 2025) and cluster the data into five clusters (i.e., pyromes). Each pyrome possesses distinct characteristics across the five input variables. Ultimately, there are six sets of pyromes (one per four-year interval). When compared over time, we observe how pyromes evolve in space and time and then study how they transition from one class to another between intervals.
Most pyromes tend to remain stable. Transitions occur most frequently between Non-Active, Low, and Moderate (P0, P1, P2). Some transitions occur in Moderate/Severe (P3), while fewer occur in High Activity (P4).
Transitions between pyrome classes from one interval to the next may also cluster and show spatiotemporal patterns. P To measure this, each pyrome classes is weighted numerically (P0=0 to P4=4). Then, to measure the weight of each transition, we compute the difference in assigned values (e.g., P0 to P4 yields +4). We use Local Indicators of Spatial Association (LISA) (Anselin, 1995) to measure spatial autocorrelation, which identifies clusters of intensifying (hotspots) and recovering (coldspots) regions. Hotspots indicate regions where pyromes are consistently transitioning to higher activity classes over time. Coldspots represent regions recovering toward lower activity classes.
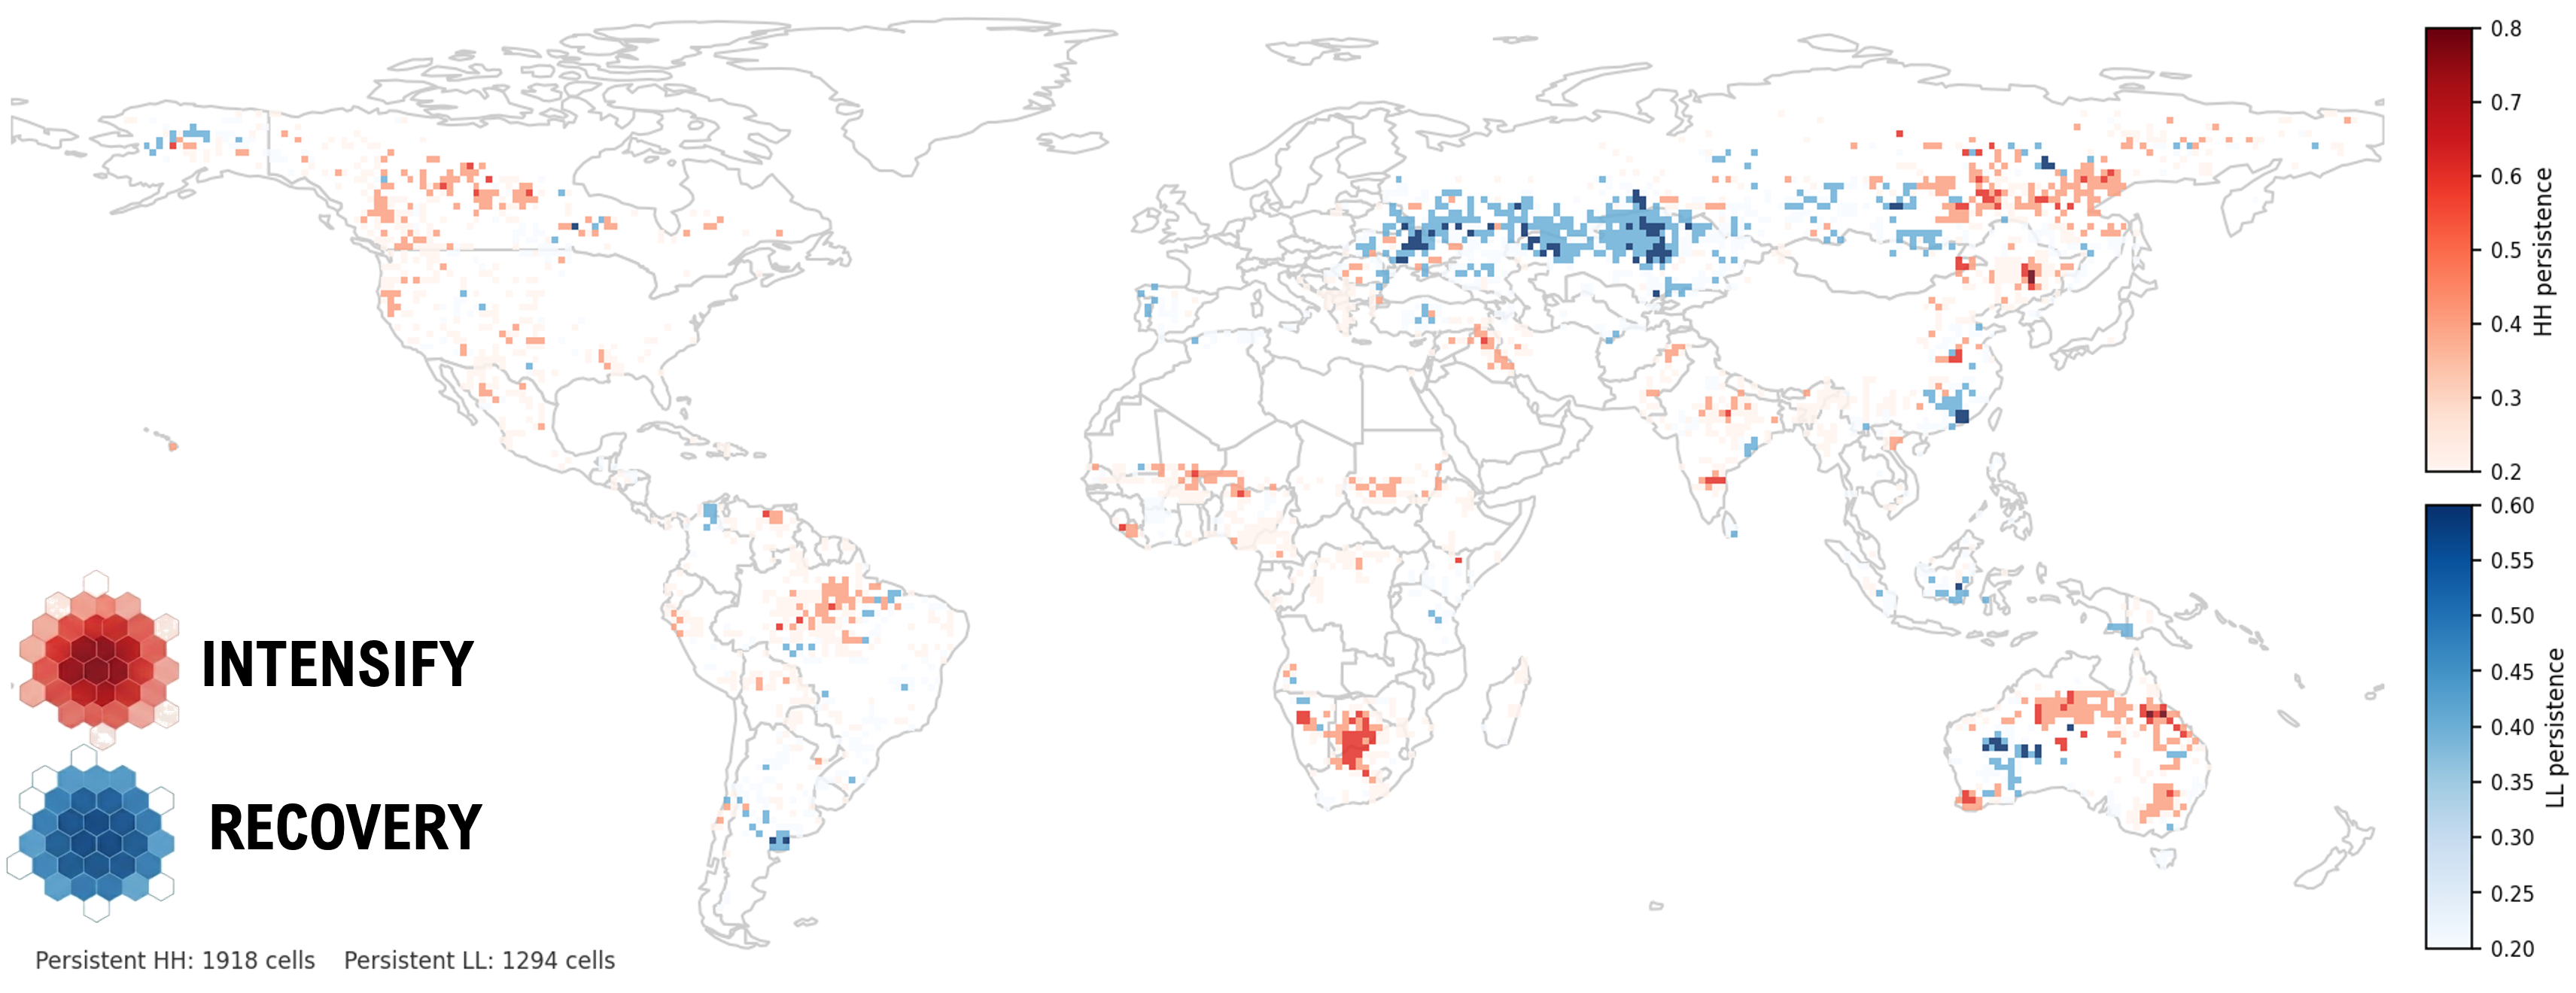
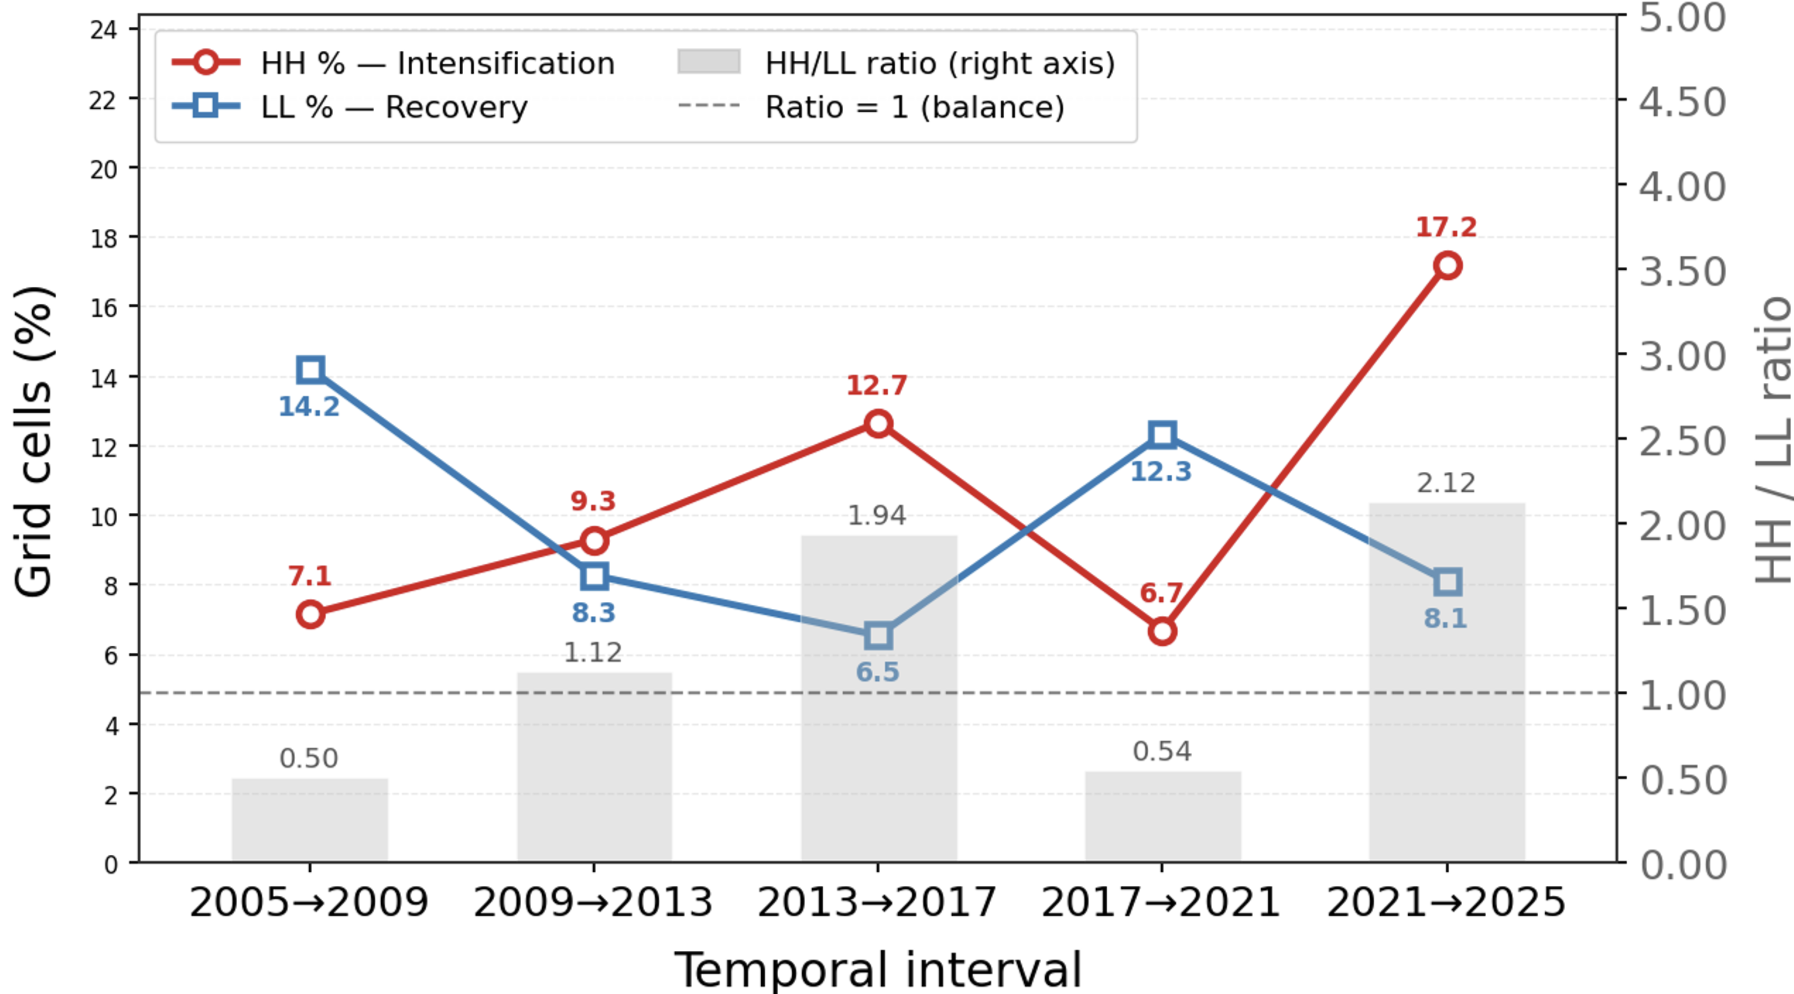
More regions (17.2% of grid cells) are transitioning into more intensifying pyromes in recent years — a near 10% increase in the past two decades. Hotspots exist globally, mainly in South Africa, Australia, North America, South America, and Eastern Europe-Asia.
Changing pyromes and continued intensification into higher activity/intensity pyromes signal that the new reality must acknowledge and prepare for fire seasons and geography shifting at a global scale.
References:
Andela et al. (2019). The Global Fire Atlas of individual fire size, duration, speed and direction. Earth System Science Data, 11(2), 529-552.
Anselin (1995). Local indicators of spatial association—LISA. Geographical Analysis, 27(2), 93–115.
Archibald, S. et al. (2013). Defining pyromes and global syndromes of fire regimes. Proceedings of the National Academy of Sciences, 110(16), 6442-6447.
Pais, C. et al. (2023). Global scale coupling of pyromes and fire regimes. Communications Earth & Environment, 4(1), 267.